
The insane correlation between Pokémon and eBay earnings

I'm driving to work and I decided I really wanted to see the numbers between the grift cycles of resellers/scalpers and collectors of different niches, I looked at graphics cards, Labubus, FunkoPops and Pokemon.
Before I start, here's the details
- Pokemon popularity was gauged from google trends 2021 to October 2025.
- eBay quarterly earnings obviously came from eBay's 10-Qs.
- I used R² to measure the strength of correlation; two runs with popularity to earnings shifting earnings 1 & 2 to the right.
- Someone on a reddit post for this said 80% isn't strong correlation. What? My man, according to statology.org "The further away r is from zero, the stronger the relationship between the two variables." (-1 to 1) .8 is PRETTY DANG FAR AWAY FROM ONE. I could also be wrong, I'm not a mathmagician
- Could this be an over-fitting curve? yeah, totally.
- I am not claiming that the hype around Pokemon cards is reason or even primary contributor to eBay's earnings numbers
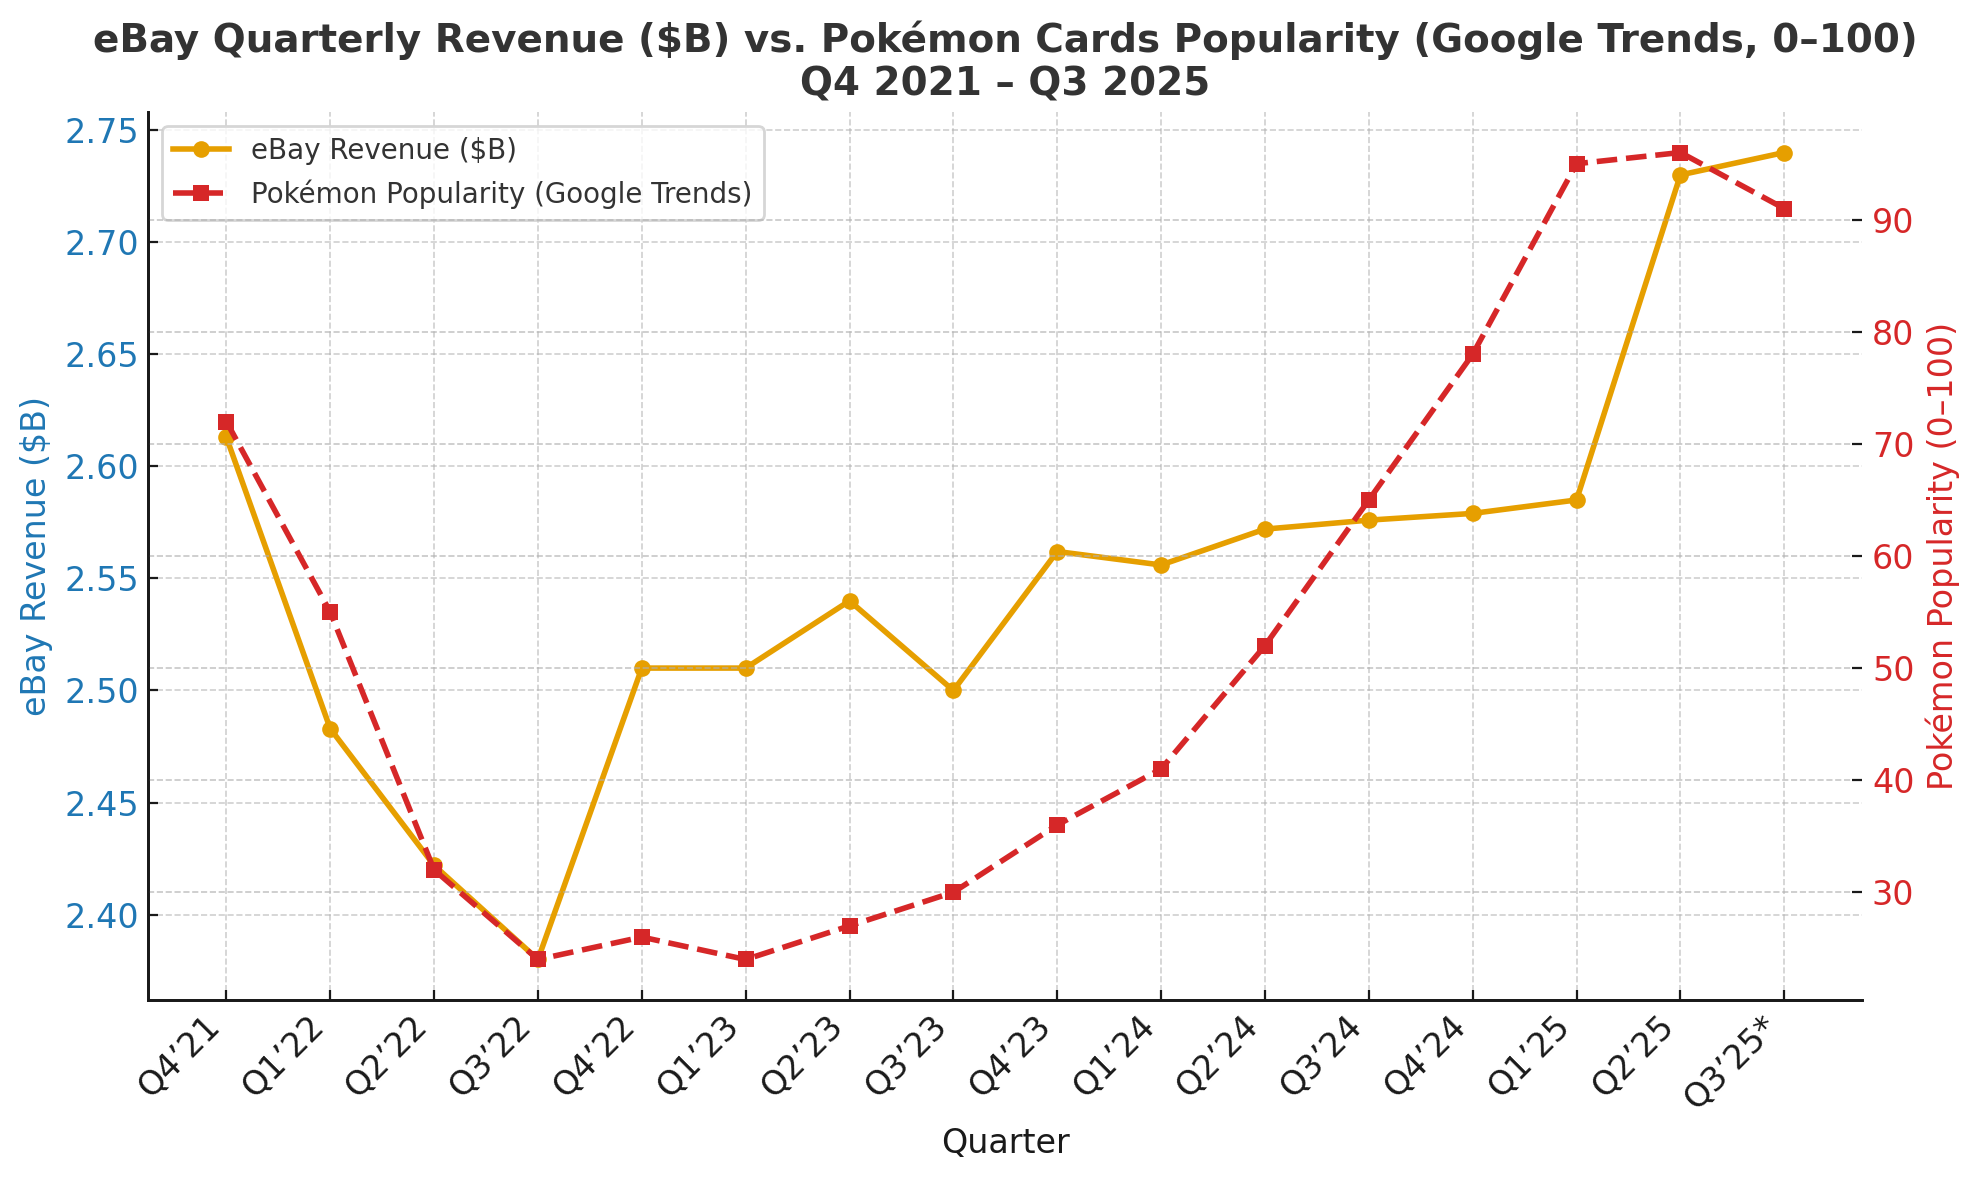
It’s pretty close right? When we look at that chart it almost seems like they match pretty well. But it gets magical when we shift the chart by two quarters.
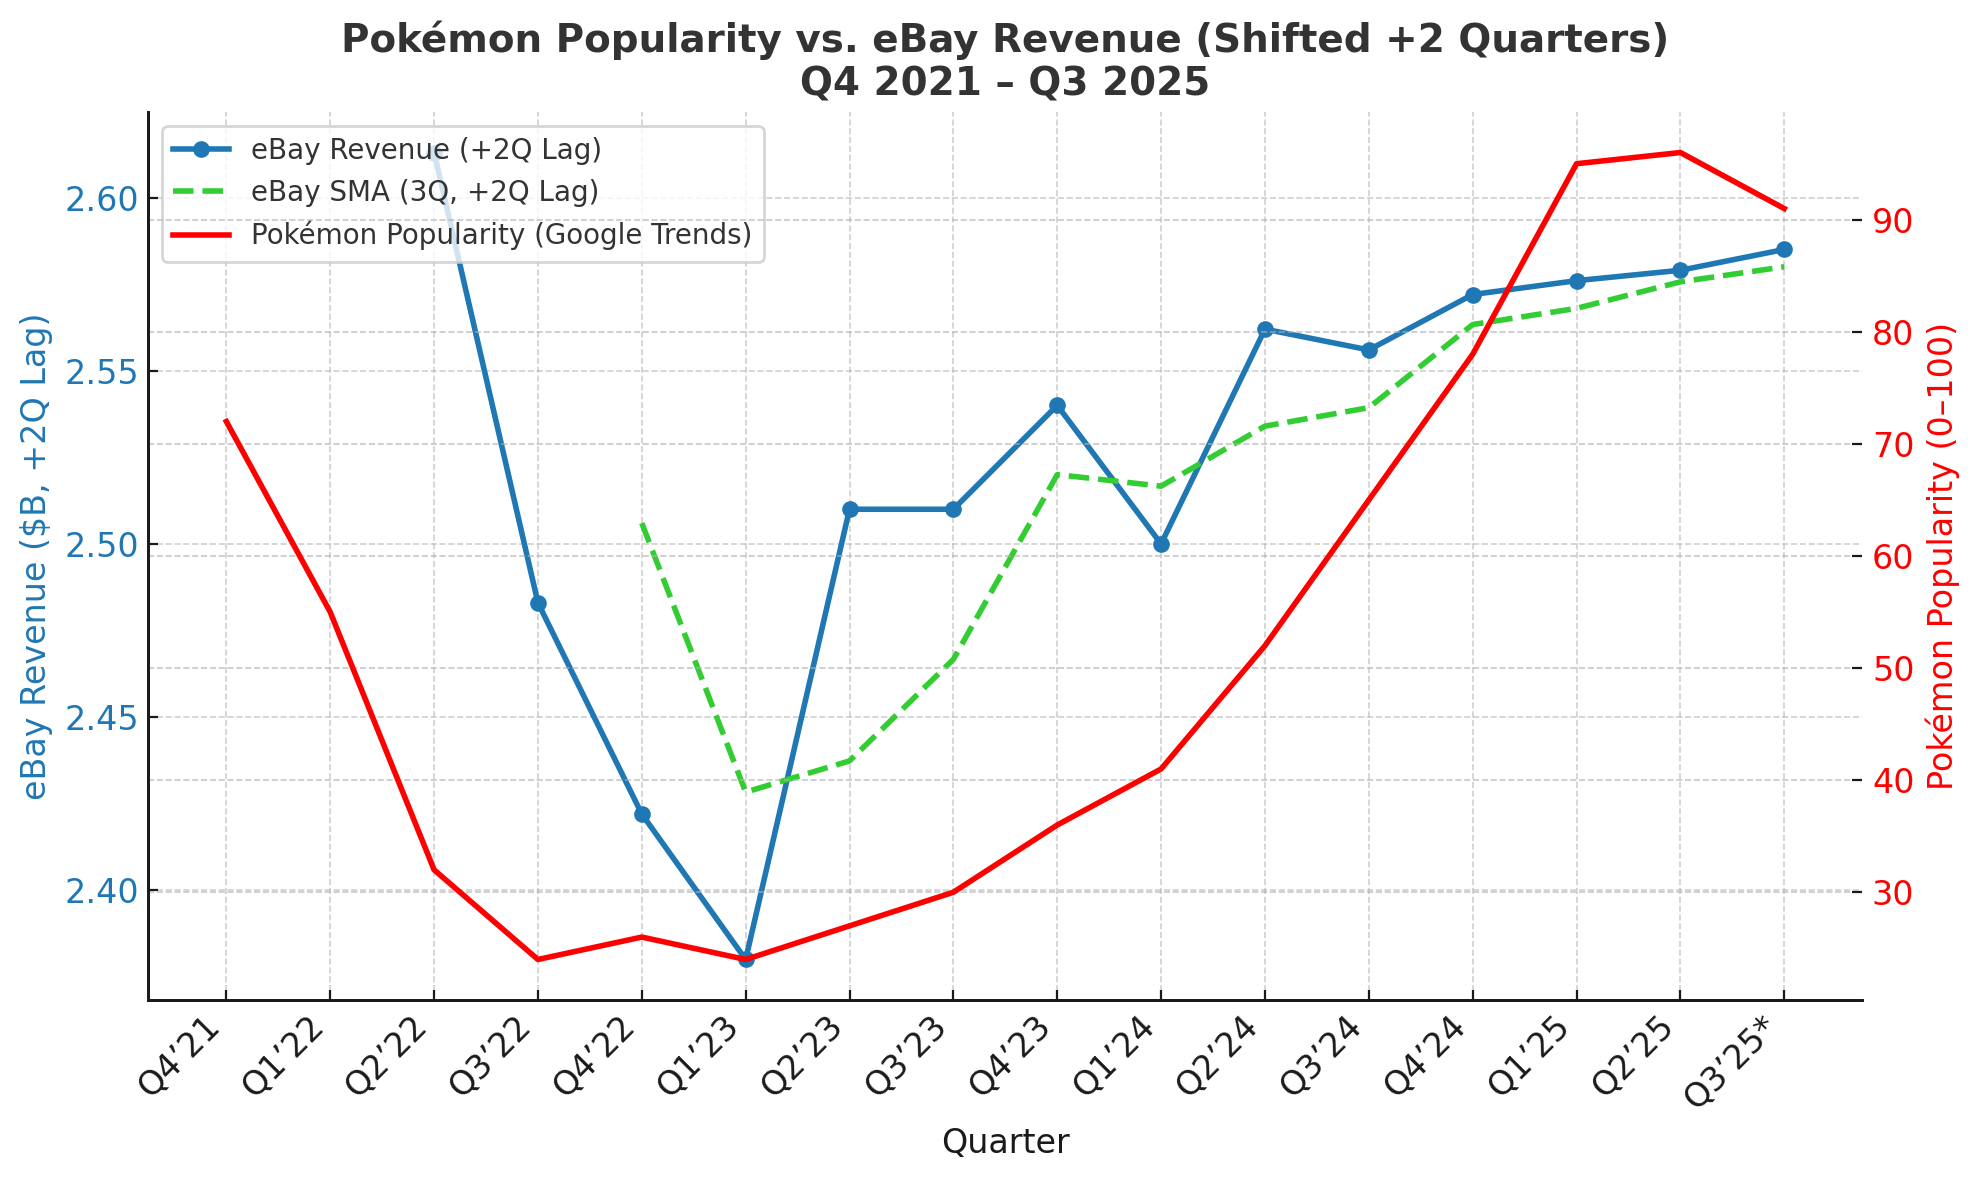
Lets look at the correlations
Lag-1 (Pokémon Q3'25=91 → Q4):
eBay = 2.457 + 0.0025 × 91 = $2.687B (R²=74%)
Lag-2 (Pokémon Q2'25=96 → Q4):
eBay = 2.463 + 0.0028 × 96 = $2.733B(R²=81%)
Ensemble: $2.710B | 95% CI: $2.68–2.74B
The model perfectly hit Q3 guidance ($2.69–2.74B → actual guidance $2.73B Q2).
Obviously this is correlation, not causation and it'd be silly to surmise that the hype of Pokemon cards is a primary contributor to eBay's earnings. Instead I'm using this as an gauge of the economy. From what I've seen, eBay thrives in the gully between economic prosperity and borderline poverty. That's kind of an odd idea to try to quantify, but Poke-sentiment does it pretty well.
Bottom Line: Pokémon = eBay’s leading indicator with ~80%+ predictive power. I’m Buying dips, betting on next set release.
What do you think?